

It is believed that the peak of the hydrograph is reduced by 10-15% on the respective section of the Sava River (Source: Vodoprivredna osnova of the City of Zagreb) which is beneficial not just for the City of Zagreb, but also for the entire downstream flood protection system.
Hybrid 1D/2D model for non-stationary flow along the Jesenice-Podsused section
The EU co-financed study documentation (IPF3 consortium MottMacdonald-WYG-Atkins) has been completed for the Sava Project, popularly known as Zagreb on the Sava River. The project covers the protected area of the Republic of Croatia along the Sava River from the border with Slovenia to Sisak in Croatia. VPB was chosen to develop the design documentation incorporating hydraulic calculations of surface flow and hydrological analysis. Additionally, the VPB also participated in the development of the concept. Keep in mind that what follows is a description of only a smaller part of the entire project.
In Croatia, the Sava River, along with most of its tributaries, is surrounded by embankments. However, the section from the border with Slovenia to Podsused in Croatia was until recently contained by a wide flooding plain. Namely, this is a very complex morphological, hydrological and hydraulic region.
It is believed that, at this section, the peak of the hydrograph is reduced by 10-15% (Source: Water supply resources of the City of Zagreb), which is beneficial not just for the City of Zagreb, but also for the entire downstream flood protection system.
Located at the upstream end of the considered section is the Jesenice II water metering station. At the end of the downstream area is the Posused žičara water metering station. Earlier estimates of the respective release were based on the consumption curves from these stations. In this specific case, due to the position of the Jesenice II water metering station, within the wide flood plain, taking flow measurements using an ADCP device for large bodies of water was exceptionally complex and, in general, such measurements were not attainable. This obviously cast some doubt on the quality of the curve for the defined consumption relationship. Compared to Jesenice, the flow can be measured at Podsused, given that there is a bridge there from which a vessel can be withdrawn along with the ADCP device, therefore, making the consumption curve more reliable.
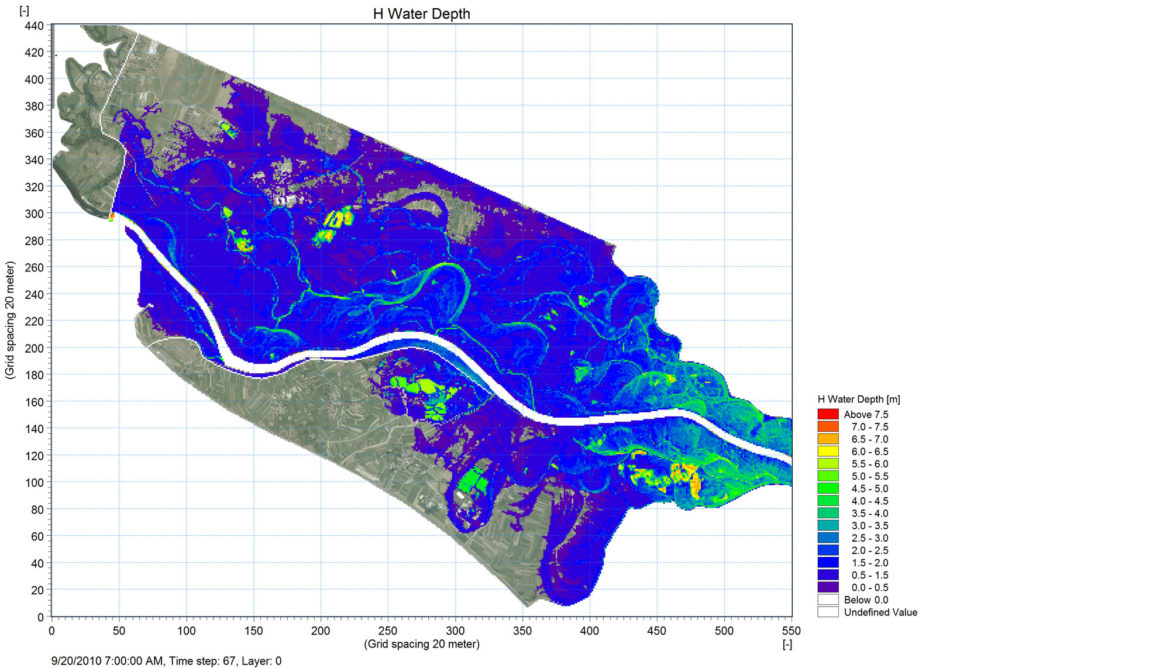
Due to the abovementioned reasons, the decision was made to establish a hybrid 1D-2D simulation flow model, which shone new light on the issue of reducing the peak water wave. For that purpose, a LiDAR surveying of the area was obtained. The model was performed in the MIKE Flood application, combining a 1D numerical approach to tributaries and channels and a 2D approach to flooded areas. The simulation model showed that the actual reduction of maximum flow was less than expected (10-15%) and amounted to 3-10%, depending on the water wave shape and maximum.


